I have been a scientist for 30+ years. What makes the scientific enterprise so valuable is that it sheds a bright light on our cherished assumptions, providing a chance to scrutinize what we believe by quantifying phenomenon of interest. My heroes are scientists who reveal truth where assumptions pervade. As a scientist and hockey fan, I wrinkle my brow every time I hear commentators and analysts say that parity is at peak in the NHL. The NHL is credited by many (see for example the 2019 commentary in The FlightCast) as being the league that has done the best job of maximizing parity (which we can define as evenly distributed talent and winning opportunities across teams). Every time a weak team beats a top team, the parity talk follows. Last night, the lowly Coyotes beat the mighty Leafs, and today, we hear renewed talk of how much parity exists in our league. If I had a nickel for every time I have heard people claim peak parity I could buy an ice-front ticket.
The truth is that league parity is very easy to measure rigorously. Statisticians have a very simple metric for determining the average variation in a set of numbers. It’s called the standard deviation. It measures how spread out a group of numbers are. We can look over time at the standard deviation of team points or goal differential as a solid way to quantify parity. When parity is high, points and goal differential will be low, with most teams clustered around the average. When parity is low, teams are more spread out and the standard deviation will be higher. So let’s look at the data for the NHL since the 1990-91 season.
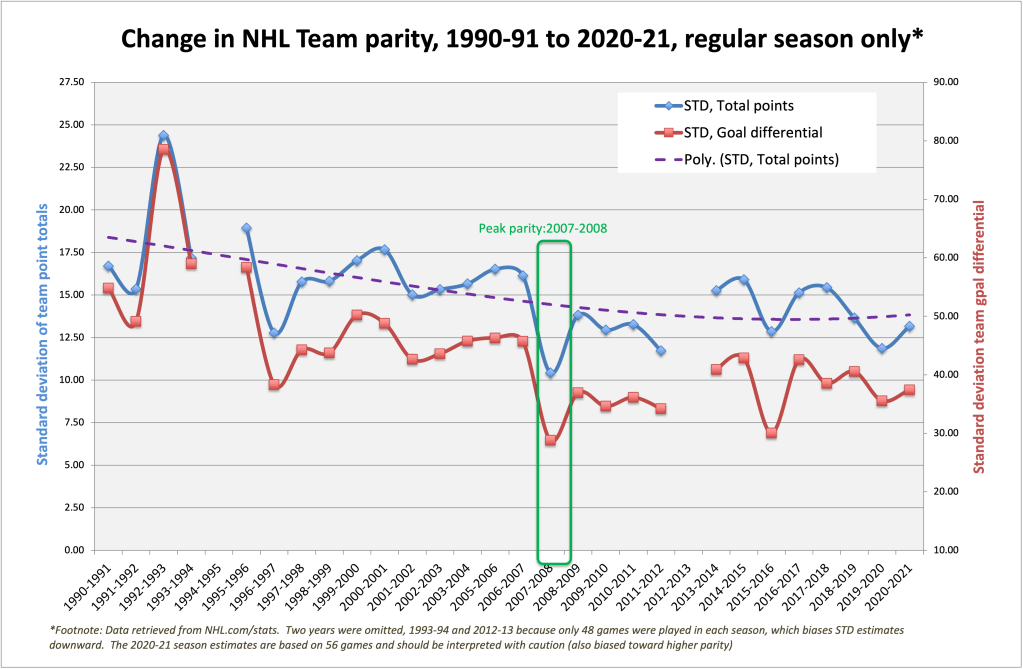
One limitation of the standard deviation is that it isn’t directly comparable between sets of numbers based on different sample sizes. As a result, I dropped the 1993-94 and 2012-13 season because there were only 48 games played. Fewer games means an artificially lower standard deviation because teams don’t have as much opportunity to spread out. With the exception of 2019-20 (71 games) and 2020-21 (56 games), all other seasons saw at least 80 games. There are three lines on this graph. The red line is the trend in parity based on the standard deviation (SD) of team overall goal differential. The blue line is the SD for overall team season points. The purple line is a trend indicator based on a 3rd-degree polynomial spline. For all these lines, lower numbers mean higher parity (or less spread out data). So what do we see in these data?
The first thing to say is that parity was at its lowest in the 1992-93 season. That year, the Penguins won the President’s trophy with 119 points while the lowly Senators and Sharks amassed a scant 24 points over 84 games. Between 1990 and about 2008, there was a stead increase in parity across the league (based on the purple trend line). The peak in parity occurred in the 2007-08 campaign (lowest SDs). That year, the President’s trophy went to the Red wings (115 points). The parity peak came from a relatively strong performance from the bottom dwelling teams. That year the Lightning and Kings were the worst teams at 71 points. Parity reached a second highest level in 2015-16 when the Capitals surged to 120 points, with the Maple Leafs at the bottom with a respectable 69. We have to be a bit cautious about interpreting the numbers in the last two COVID-impacted seasons because those numbers are based on only 71 and 56 games respectively. Given that fewer games biases toward higher parity, the last two seasons reflected far less parity compared to 2007-08 or 2015-16. What drives parity in the NHL is the performance of the worst teams, not the teams at the top.
There have been three big changes in the NHL since 1991 that explain the gains in parity. Two of them were explicit league interventions designed to boost parity. The first was the addition of 9 expansion teams in the decade between 1991 and 2001. More teams in theory would be expected to reduce parity. The second major change, and one that was explicitly intended to enhance parity, was the salary cap. Both the 1994-95 and 2004-05 NHL lockouts were fought over the salary cap. The NHLPA finally agreed to a “hard” cap at the start of the 2005-06 seasons. The salary cap did more than anything else to level the playing field in hockey and put the lid on NHL dynasties. That last factor was the introduction of the shoot-out and the elimination of ties, also after the 2004-05 lockout. The loser point introduced by this change has driven parity up by introducing more variance.
In summary, there was a trend toward rising parity from 1990 until about 2007, driven largely by the salary cap and the “loser” point. The NHL’s efforts to boost parity worked. However, in the last decade parity in the NHL has gone up and down with relative stability. The claim that parity is now higher than it’s ever been is simply wrong.
