The 2019-20 entry level draft is finally behind us and everyone is talking about the tremendous success of the U.S. national team development program. The U.S. tied Canada with 11 players in the first round. Overall, the U.S. and Canada drafted 124 of the 217 players drafted this year and 22 (71%) players in the first round.
Looks like North American dominance of the NHL is on solid ground, right?
Consider however the results of this years NHL awards. A couple of things to notice:
North American players won only 1 of the big seven awards (excluding Jack Adams).
Since the 1999-2000 season, North American players have averaged nearly half of the awards won (3.7).
In only 1 other year since 1999-00 has North America garnered only 1 award (2011-12).
This is the third year that Russian players won 4 awards (07-08, 08-09).
This year marks the 12th year since 1999-00 that an American player has not won an award (and the second consecutive year).
This is only the second season (after 2011-12) where 6 of the awards went to non-North American players.
The NHL has always been an international league. North America (and the U.S.A. in particular) continue to demonstrate dominance at the doorway to the league. However, at the most elite level, the rest of the world is catching up.
Salaries are rising in the NHL and rising fast. The cap has gone up but slower than many hoped. It’s time to wonder whether things are moving too fast for the long term health of the league.
How would we know if it’s getting nutty (or more importantly, unsustainable)? One simple idea I had was to compare the value of players signed in the last few months to a few select, undisputed high value players from a few years ago using a metric that allows an apples-to-apples look.
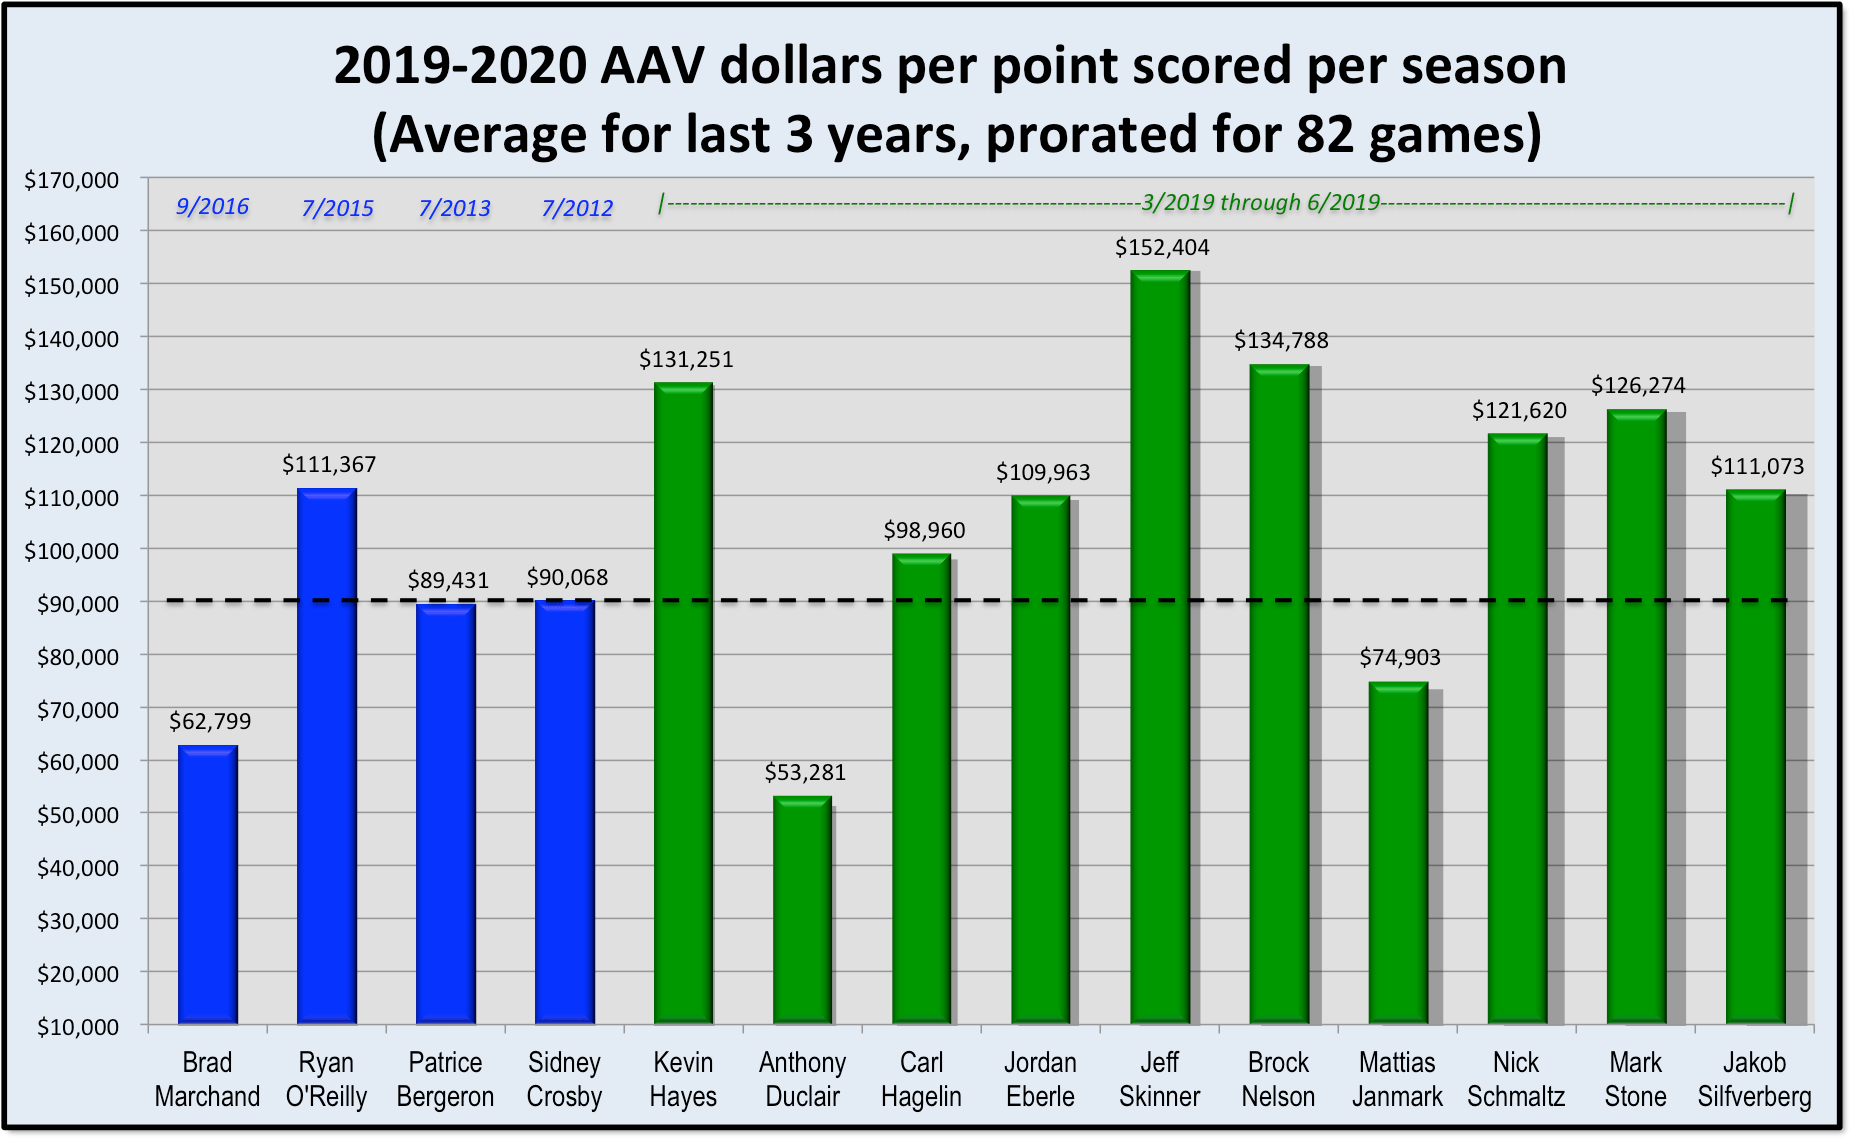
To do this, I used data from NHL.com and CapFriendly to compare what teams will be paying players in 2019-2020 in AAV dollars per point scored per season. Here is what I came up with:
The details: The blue bars represent players “gold-standard” high-value players who signed standard contracts between 2012 and 2016 (signing dates in blue above). The green bars are all the standard (not entry-level etc) contracts for forwards signed since March 1, 2019. To maximize comparability, I took games played and total points scored for the past 3 seasons and estimated an average points scored per season weighted to assume each player played the same number of games (82). The dollar values are the AAV for the 2019-2020 season based on CapFriendly. No performance bonuses were taken into account. My method differs from CapFriendly’s way of computing dollars per point.
So what do we make of this?
The most recent (standard) contracts signed for forwards in the NHL have been consistently higher in AAV dollars per point than even the best-of-the-best from the recent past.
Lets look at how teams are paying recently signed players compared to Sid Crosby, who all would agree is a high-value player. All but 2 of these forwards are making more per point than Crosby. That does tell us there is some variability in player value in the newest contracts. On the other hand, its worrisome for the league that players like Duclair and Janmark are now making comparable dollars per point.
Three contracts really stand out here. Teams are paying Kevin Hays (46% more), Jeff Skinner (69%) and Brock Nelson (50%) around fifty percent more per point compared to Crosby. This signals a salary inflation that doesn’t match the rise in the cap.
How long will it be before valuations for top players become so out of whack that teams are unable to round out their rosters with lower priced talent?
Obviously, salaries are going up and they should. But, what does it mean for the league when solid NHL players are making 50% more per point than super star gold standard players?
Using this metric shows the salary inflation in a different light by putting salaries in the context of value (at least as far as points).
I believe the NHL is headed toward a bubble.
The Details: Blue bars represent selected “gold standard” high-value players who signed standard contracts between 2012 and 2016 (signing dates on top in blue). Green bars are all the standard contracts signed since March 1 2019 for forwards. To increase comparability, I took games played over the past 3 seasons and total points scored to create and average points scored per season. That number is prorated to simulate what each players average point production would be if each had played 82 games each season. Data come from NHL.com and CapFriendly.com. My method differs from the method used by CapFriendly to estimate dollars per point scored. My method ignores performance bonuses.
Greg Wyshynski (Twitter: @wyshynski) reports that Bill Daley is open to looking at tweaks to the offside video review rules to bring us back to sanity (NHL network radio, 5/29/19). If we can find such a tweak it would allow us to implement in a way that honors the original intent (stop egregious violations resulting in goals) but reduce the hair-splitting.
The highlighting is my own. The spirit of the rule invokes a 2-skate principal. Implementation allows for a big loophole: a player with one skate in neutral ice, or part of a skate on or over the line is safe. This rule is challenging for linesmen in-game, but its basically been around in some form since the 1920’s and seems to work OK.
The insanity arises because we insist on keeping the offside rule for in-game action and coach’s challenge and video review the same (see rules 78.6 and 78.7).
Here is a simple idea that might allow us to have our cake and eat it too.
What if there were two separate rules, one governing in-game action, and a separate rule to overturn a good goal call on the ice resulting from a coach’s challenge or league initiated video review?
Here is the idea: Keep the rules governing offside calls exactly the same for in-game action following Rule 83. Its not perfect but we are used to it. Then, create a new rule setting a higher bar to overturn goals on the ice by eliminating the one skate loophole. This new rule would require that the player be completely offside, meaning BOTH skates clearly and evidently in the attaching zone. This change would a) uphold the spirit of the main rule, b) reduce the number of goals disallowed, and c) limit challenges and video review to more egregious violations.
Some will say that this would only shift the micro-analysis to the second skate. I don’t think so. I have reviewed video from dozens of close calls; in the majority of cases, its much easier to determine if both skates are over the line. Because players often intentionally ride or straddle the line when things are close, it makes sense that its easier to see when both skates are offside than to determine if some fancy skate work invokes the loophole. This change would not solve the vertical plane problem (one skate in the air over the line) but anything like that in the gray zone (e.g., partial blade on the line) would be, under this proposal, insufficient to overturn a good goal.
If a player must have both skates in the attacking zone to overturn, we get closer to the spirit of the video review initiative. The only people who might complain are the video coaches whose importance has grown from all this hair-splitting confusion.
In hockey, there is a whole family of statistics we really need to evaluate talent and make predictions that we can’t get because the data is so hard to acquire.
This is especially true of goalie performance. Blah blah blah. Let’s save that for later.
We are now in the “NEW NHL” (whatever that means). At least it means the rising importance of team speed, higher value of skill play, and, most importantly, puck control. If Team A has control of the puck the entire game, it only makes sense that the other team is less likely to score.
We lack decent statistics to inform us about how well teams do the NEW NHL. We can track team time of possession, which is fine, but that doesn’t tell us about the value of individual players in grabbing, holding and advancing the puck control agenda.
I propose a new statistic I will call player sure-handedness. It’s a simple idea. Let’s track each time a given player on the ice takes possession of the puck during gameplay. Once player X takes possession, what he or she does with it has a great deal to do with whether good things happen or whether puck control will shift to the opposition.
I listened intently to the talking heads of the hockey world all summer and during the nascent 2018-19 season. At some point, I have heard some luminary proclaim all four of the divisions as the best, toughest, most competitive division. There are no easy games X4. Parity is the new religion of the NHL. But that seems sloppy to me.
So which division is the most challenging? Some say it’s the Atlantic. Others say the Metro. Others will say the Pacific or the Central. If we consider all of the 2017-18 season from a data standpoint, what question could we ask to address this question more systematically?
It’s a fundamental question. It gets at the degree of stochasticity in the NHL.
The theme of this blog is that stochasticity is underestimated by hockey experts.
How much of what happens in cold ice rinks in the NHL is actually random vs. predictable? Well, if we lean toward the random, we undermine the GMs, scouts, and talking heads both at NHL Radio and among the throngs of analytics people. If we lean the other way, we make a case for a deeper dive into more and more arcane data.
After their sleepy start in the 2015-16 campaign, many were surprised that the Pittsburgh Penguins won the Stanley Cup. What was the secret of their second half success? Most experts will say that the answer is team speed and their ferocious forecheck. If this is a “copycat” league, we are likely to see many teams looking to increase team speed in reply. Are we entering a new phase in hockey? Is team speed the new thing?
The World Cup of Hockey offers many reasons to be excited about the state of the game we love. However, some have questioned whether the two novelty teams are phony fabrications. Team North America (under-23 players from USA and Canada) and the pan-European team represent something other than national pride. Is this experiment worth the departure from national pride as the organizing principle of an International tournament?
These two oddball groupings may be gimmicks, but they offer something both powerful and unexpected.
It’s summertime. The Canadians are all at their cottages (whatever that means) and the NHL Network is dominated by repeat broadcasts of games we have already heard.
It’s a dull time for hockey fans.
Sure, there is the odd bit of trade news, some buzz about the upcoming World Cup, and the fascination with Boomer’s stat packs and “five burning questions.”
The summer is a time for thinking big picture about the game we love.
I keep hearing people say the playoffs are about giving 110%. It’s obvious that 110% is not possible by definition. It’s just an expression. The idea is to give all you have, to “compete,” win your shift, get to the tough areas, get sandy, and win puck battles. Giving 100% means working as hard as possible, and then exceeding maximum capacity with an extra “umph” of heart and tenacity. I get it.
But as a scientist, and a student of the game, I wonder about what it means to even try to approach 100% capacity, let alone 110%.
In truth, if hockey players actually gave 100% effort, they would be making a huge mistake. Let’s think about this a minute.
It’s true, I am a Penguins fan. I’m Steel City proud when I hear commentators say that the Penguins have been the “hottest team” in the final stretch of the season. But what does this really mean? In baseball, everyone looks at team performance over the last ten games. Sometimes we see that statistic reported in hockey. But unlike baseball, where games are played about every day, a ten-game period is a longer period of time in hockey. And, knowing that a team is 5 and 5 in the last ten does not tell us much about team momentum. Consider these examples of ten-game trajectories of three hypothetical teams. Note they are all 5 and 5 in the last ten:
Team A
Win
Win
Win
Win
Win
Loss
Loss
Loss
Loss
Loss
Team B
Win
Loss
Win
Loss
Win
Loss
Win
Loss
Win
Loss
Team C
Loss
Loss
Loss
Loss
Loss
Win
Win
Win
Win
Win
Do these teams look like they are trending the same? Are they equivalent in terms of team momentum?
As I have argued before, hockey is a cyclical game. There are nights that every puck seems to land on a friendly stick. Opposing goals fill like rabbit cages in springtime. Opposing shots ring off iron. This is a streaky game. So, how do we capture the movement and directionality of those cycles? And how do we track the momentum of a team over a season? I can’t find many good examples of this out there so I invented one myself.