If you have ever read my hockey blog you may know that my favorite way to picture the movement of teams in the NHL is what I call the team momentum index (or TEAMODEX). The idea is simple. Each team starts at zero with game 1. For each game, we plot the team’s momentum by adjusting up 1 point for a win, down 1 for a loss and 0 for an overtime or shootout loss. Below are the four divisions at the season’s calendar mid-point.
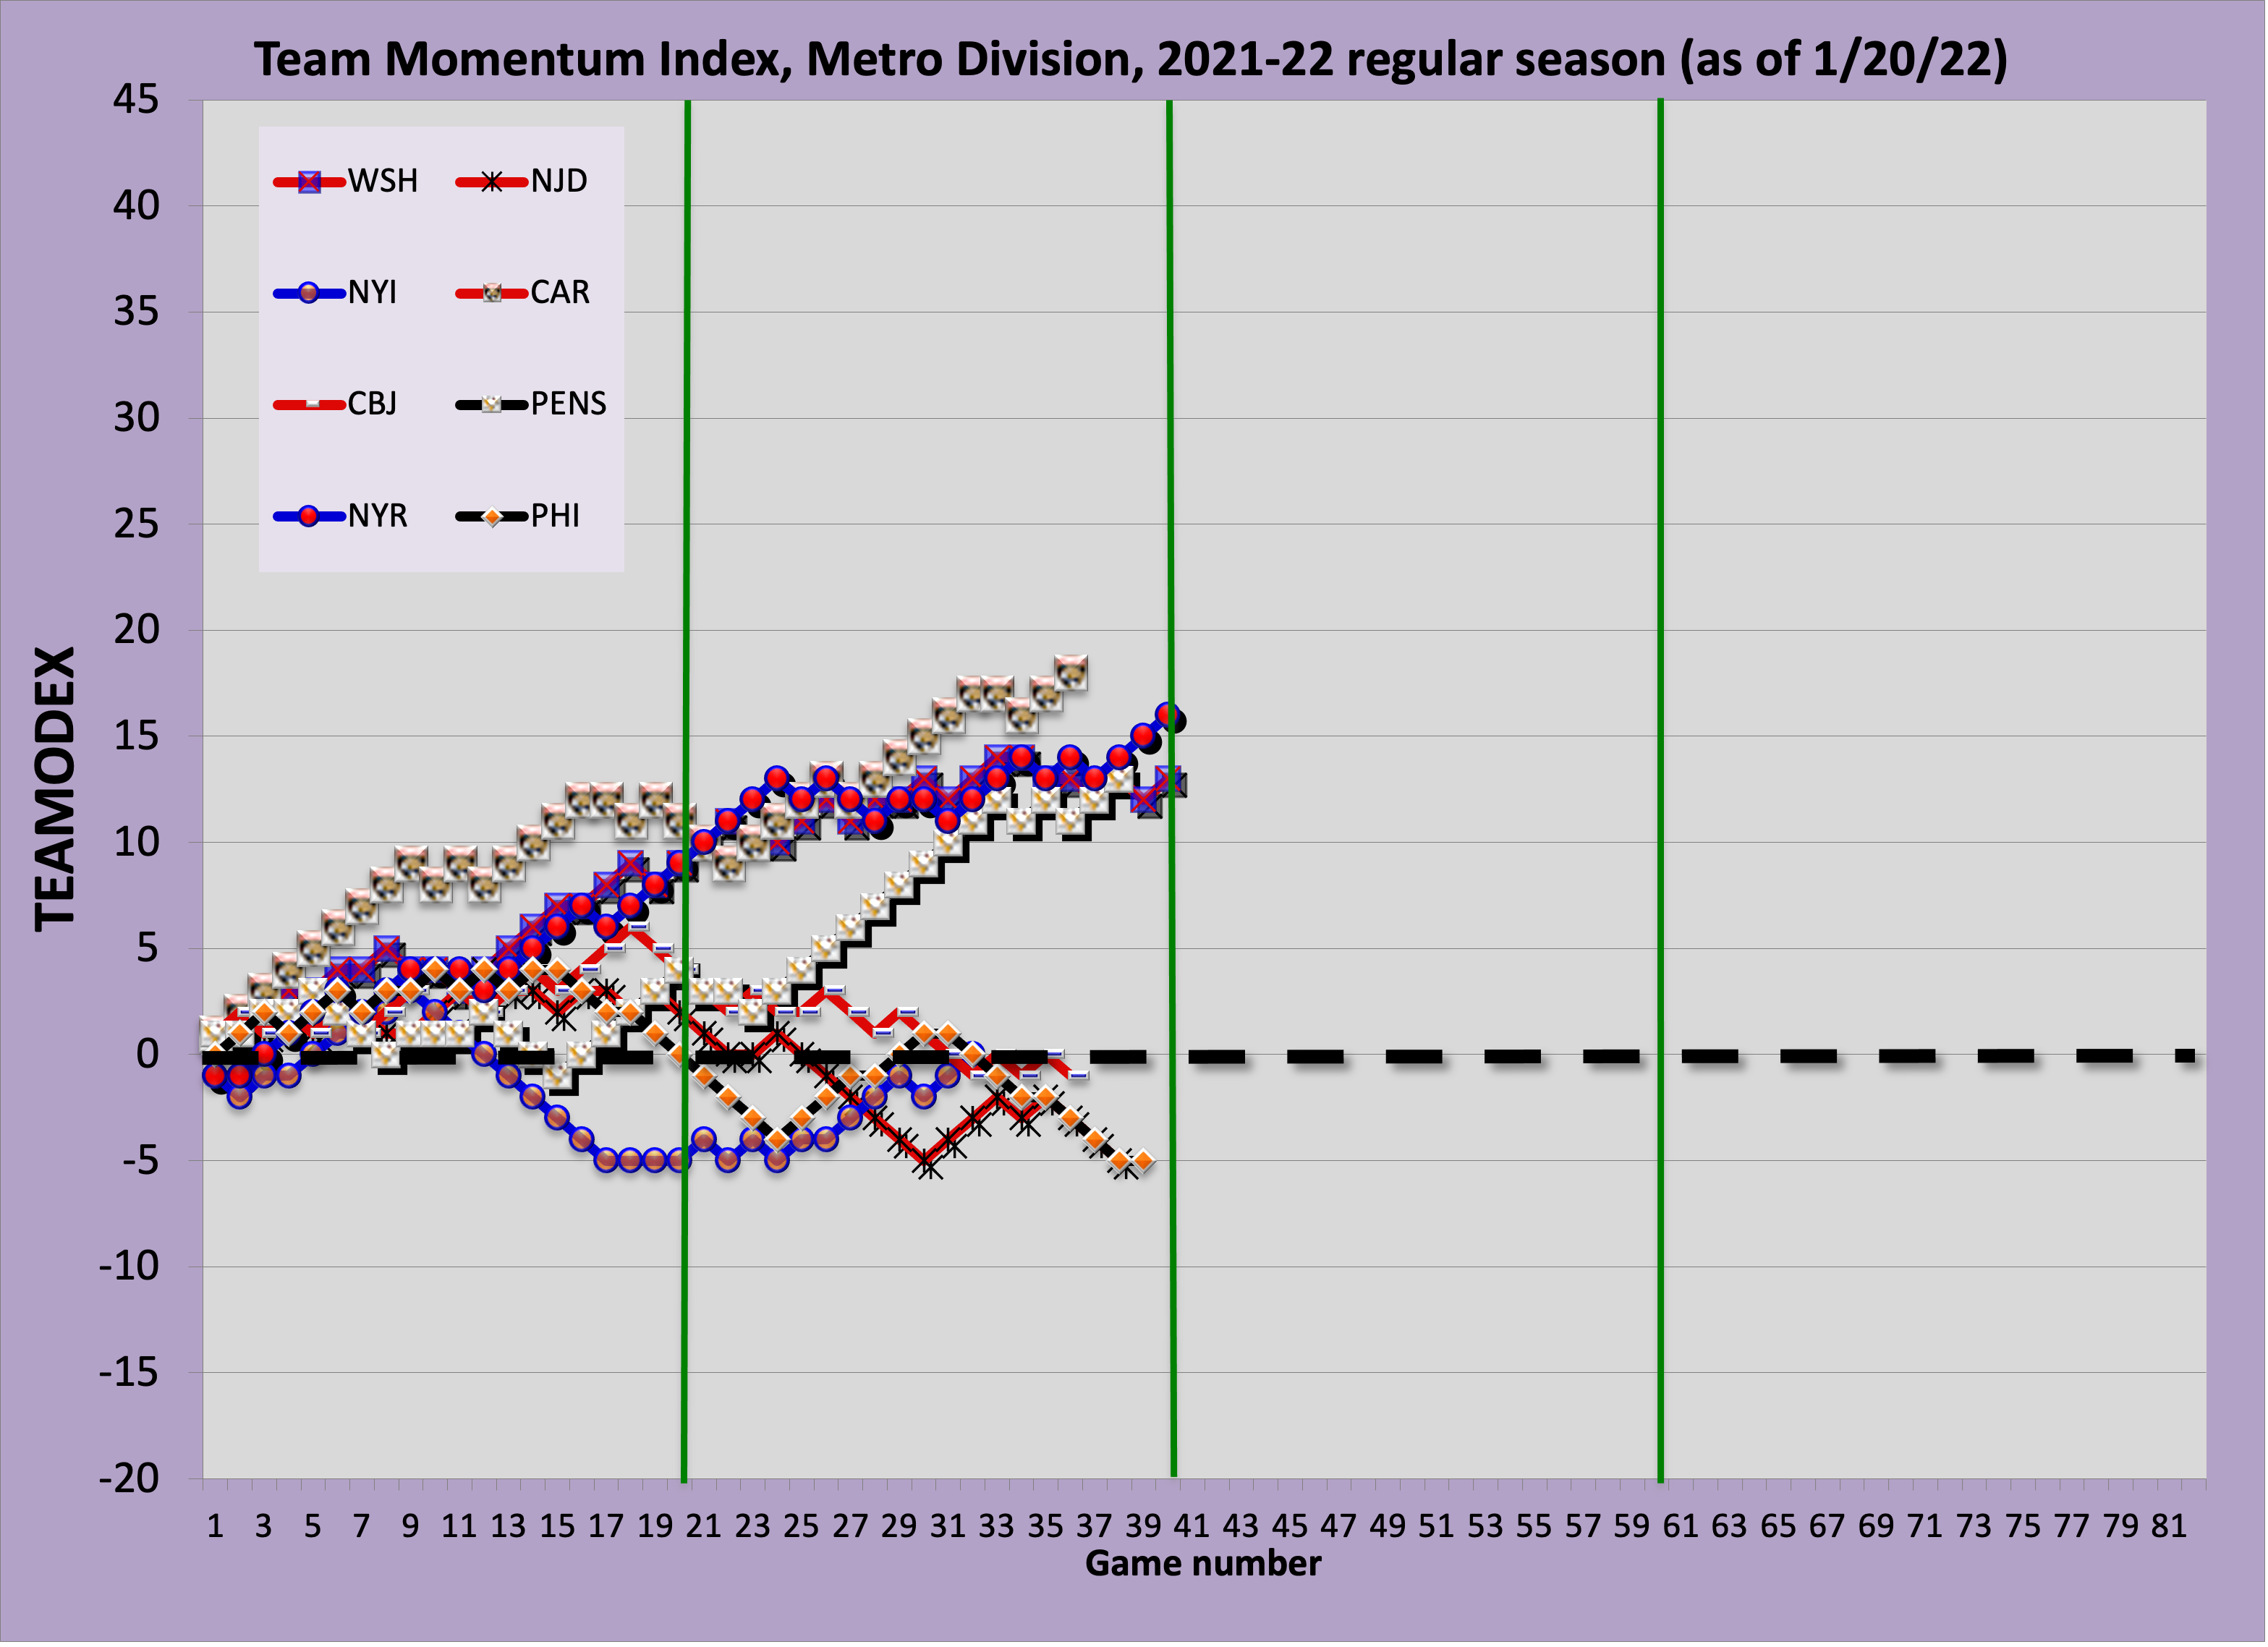
The Metro: Let’s start with the purple metro. More than any other division, the Metro, after a super hot start across the board, saw a bifurcation in the second quarter (20 game segments marked by green lines). The top 5 have dramatically split from the rest. This graph shows just how strong the Penguins have been in Q2. Early momentum from the Caps has stalled. Carolina has enjoyed 4 distinct sprints with only 1 short lapse. While the Rangers lead in points, Carolina outperformed them in TEAMODEX.
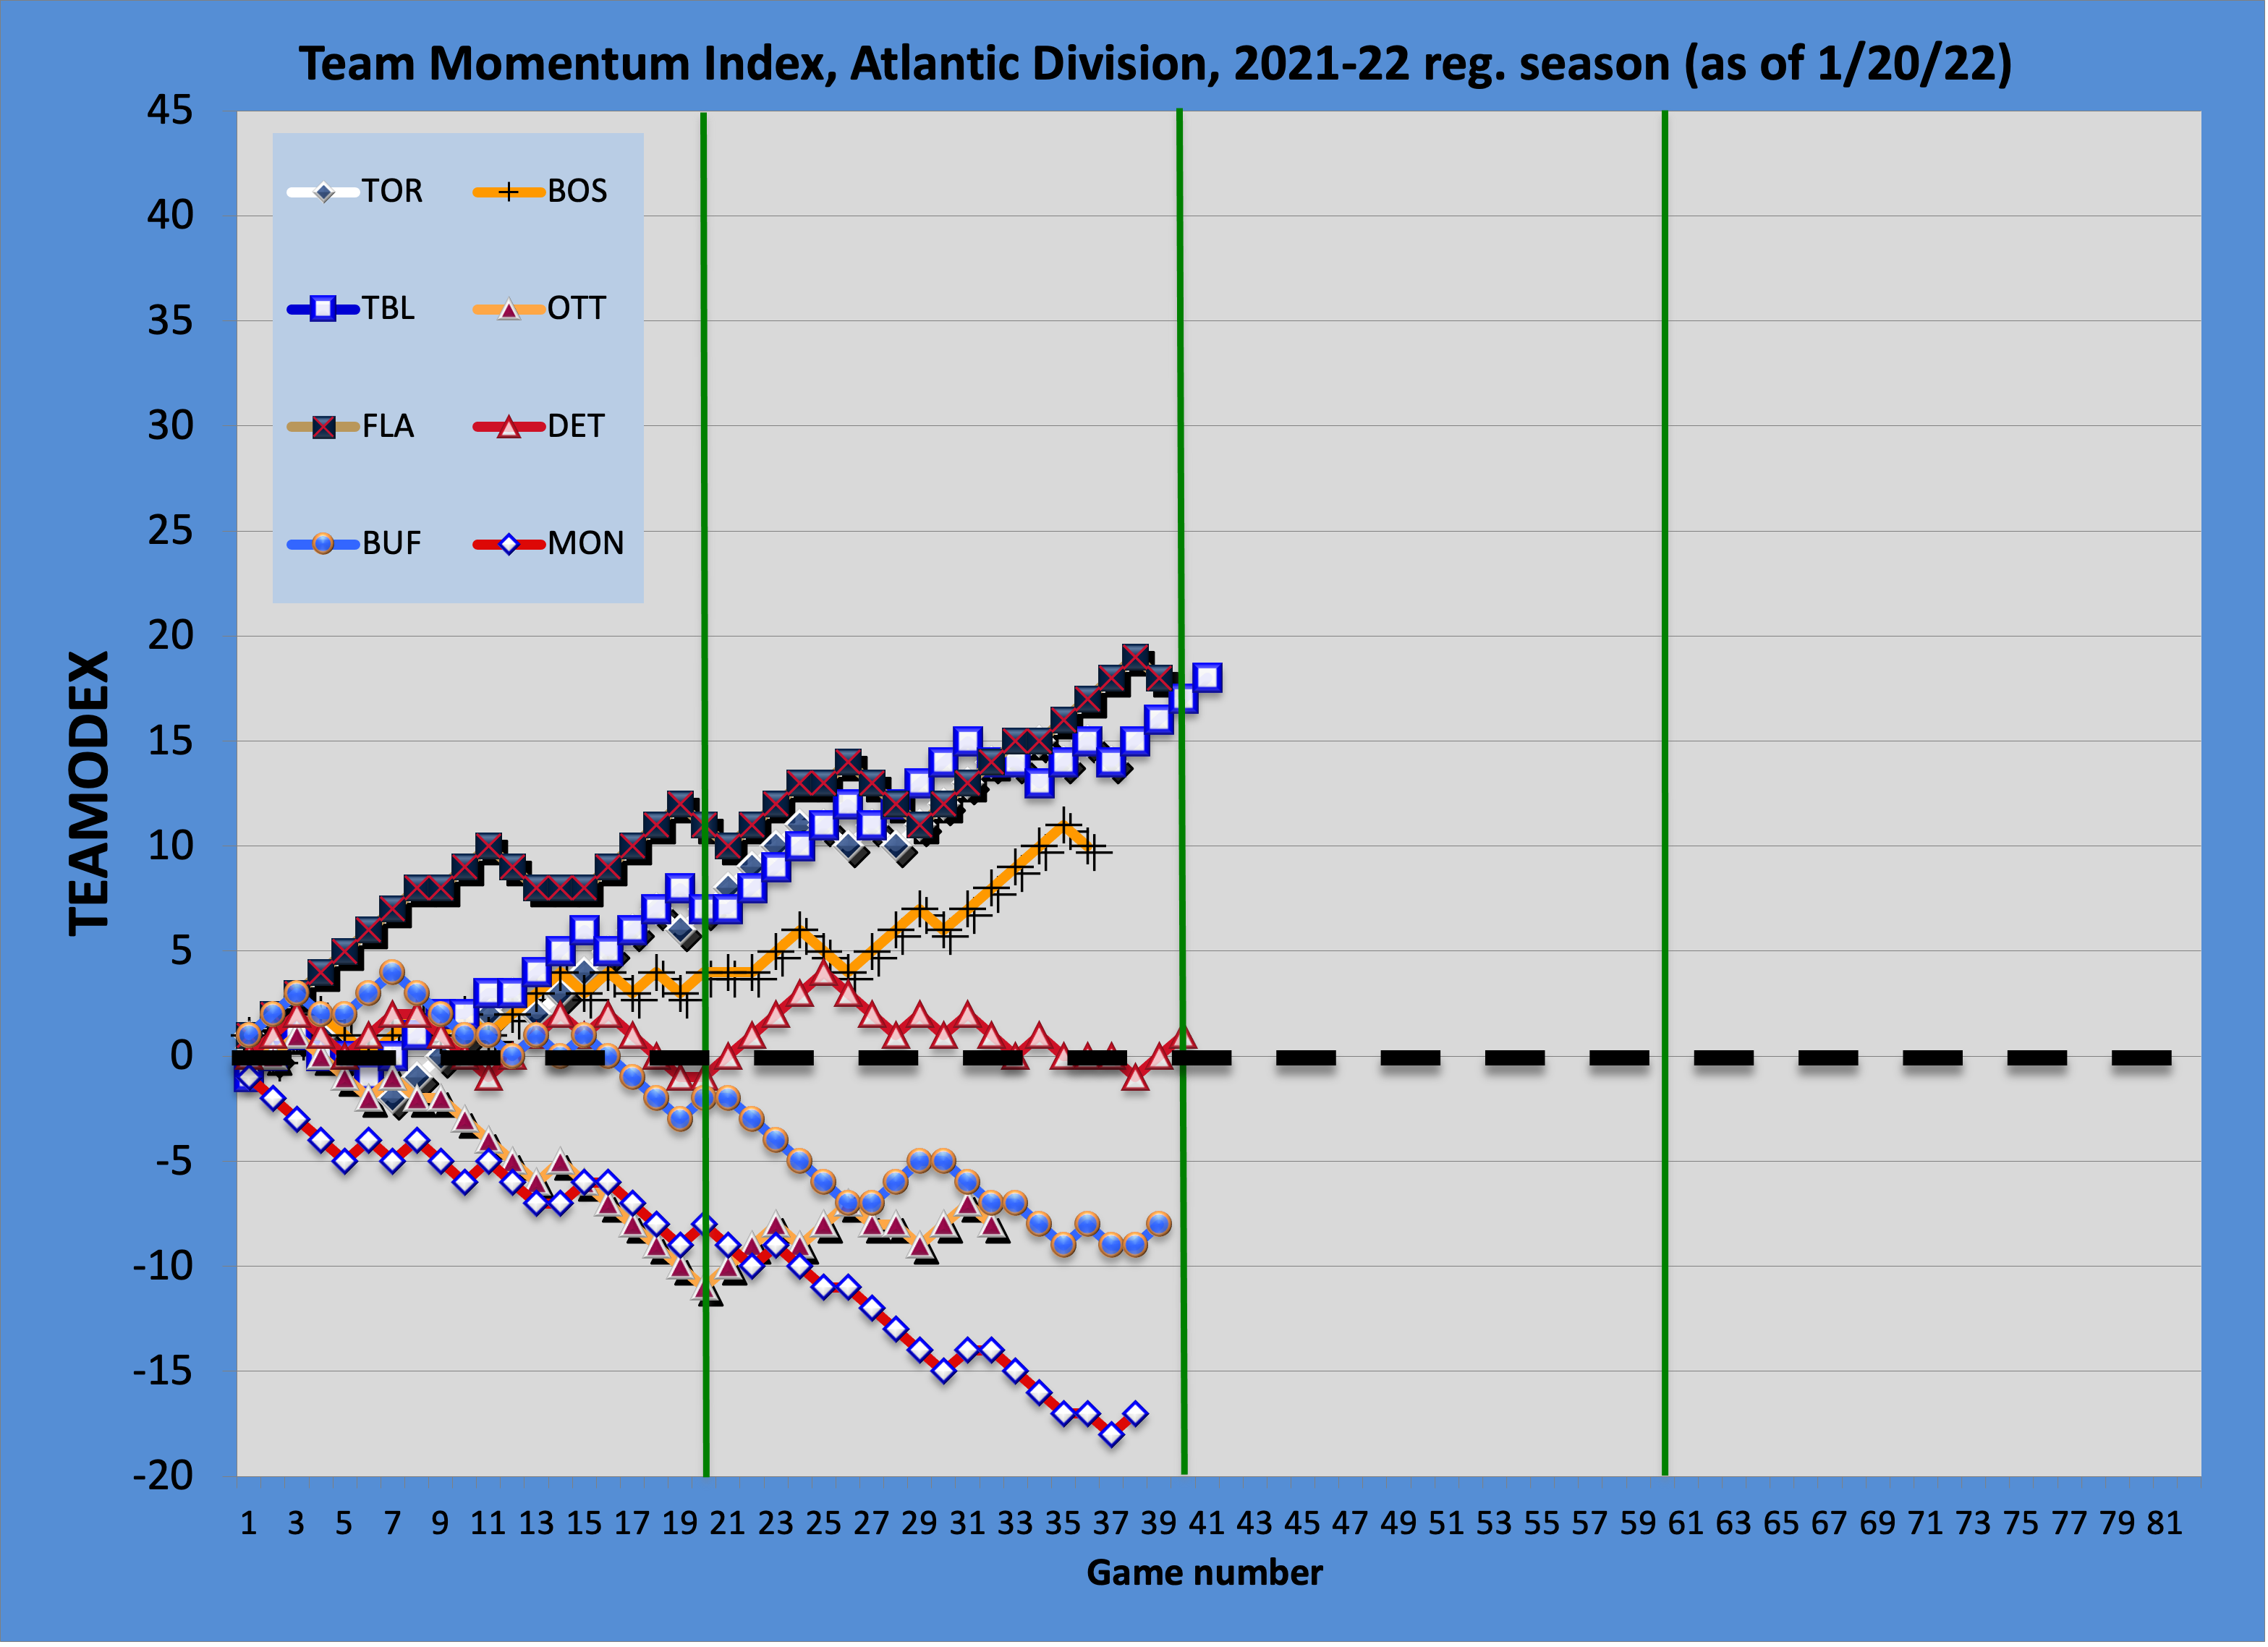
The Atlantic (blue): The Atlantic is the most widely dispersed with the Lighting, Panthers and Leafs in lockstep, battling for top spot. After a dreadful start, the Sens have leveled off in Q2. The story of the Habs could not look worse. Tampa has out-paced the rest of the division in Q2 and now leads in points. The Bruins are keeping pace with the big 3 as we approach the mid-point.
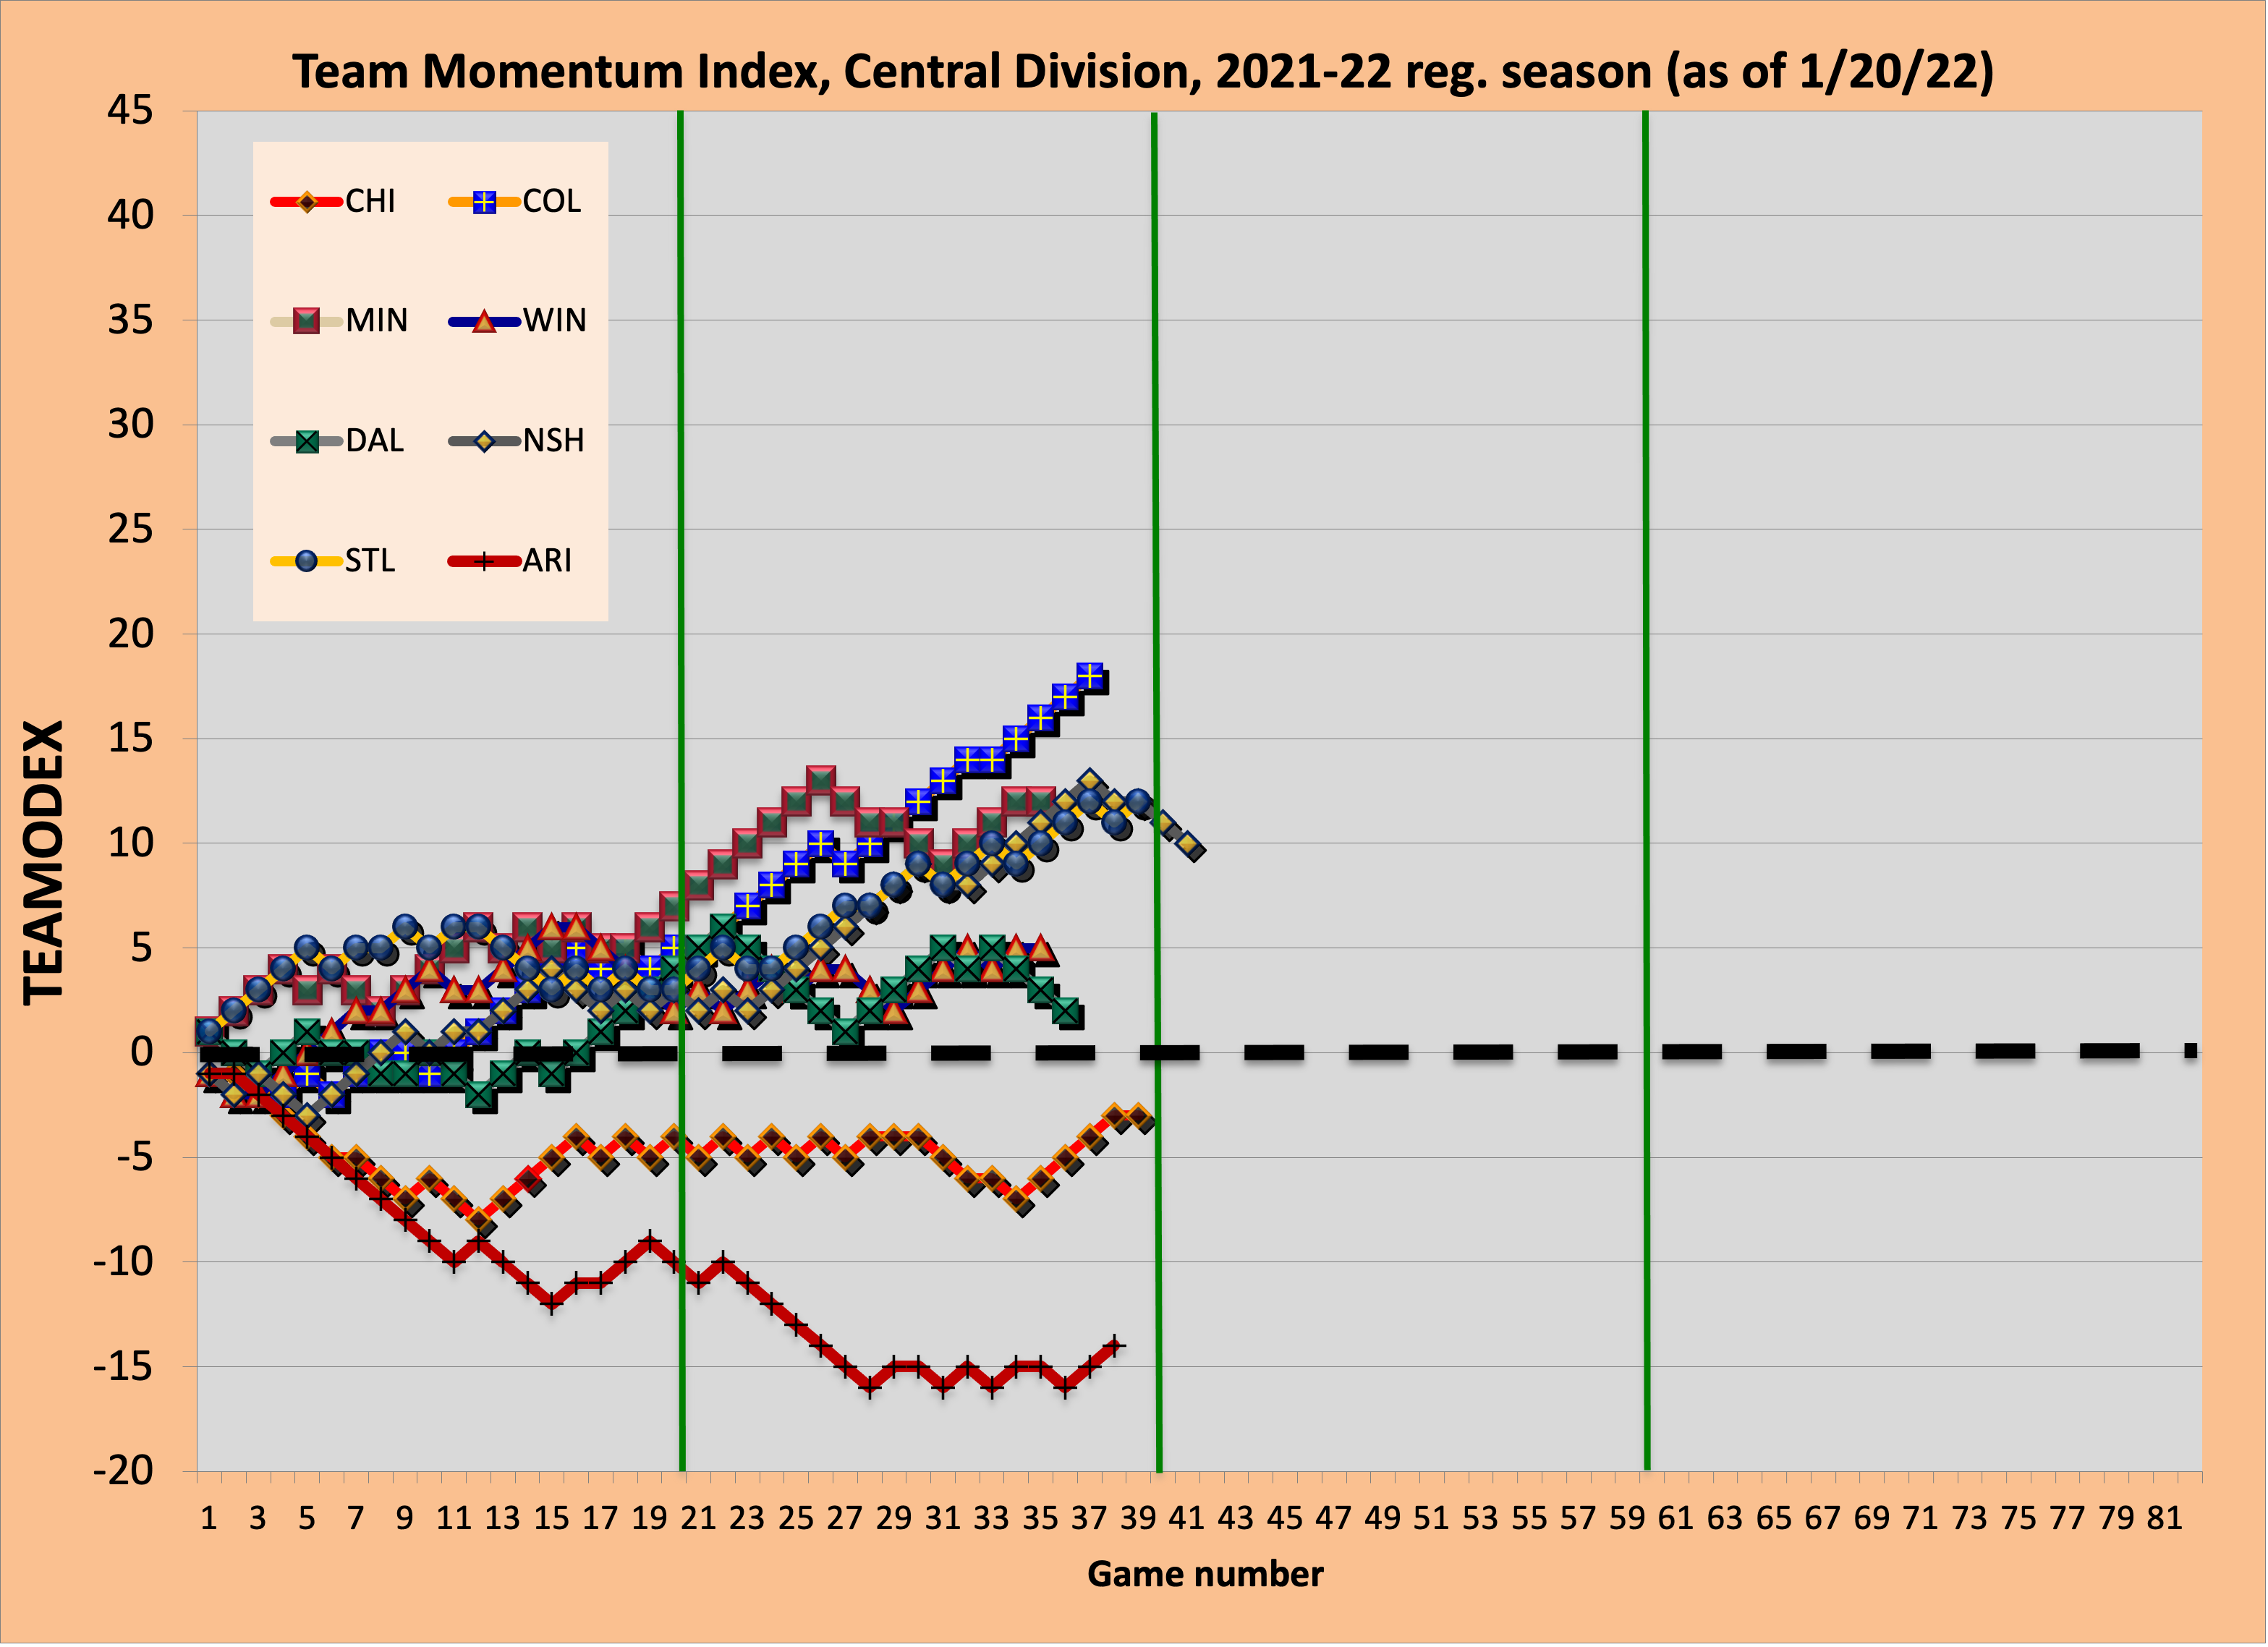
The Central (orange): The Avs had the best momentum in Q2 out performing the entire league having passed the sagging Wild at game 30. Chicago has picked up serious steam as the quarter closes after a win-1-lose-1 cycle since game 15. After a disastrous 7-game slide, the Coyotes have found an even keel. The Stars have been the yo-yo of the division (what else is new?).
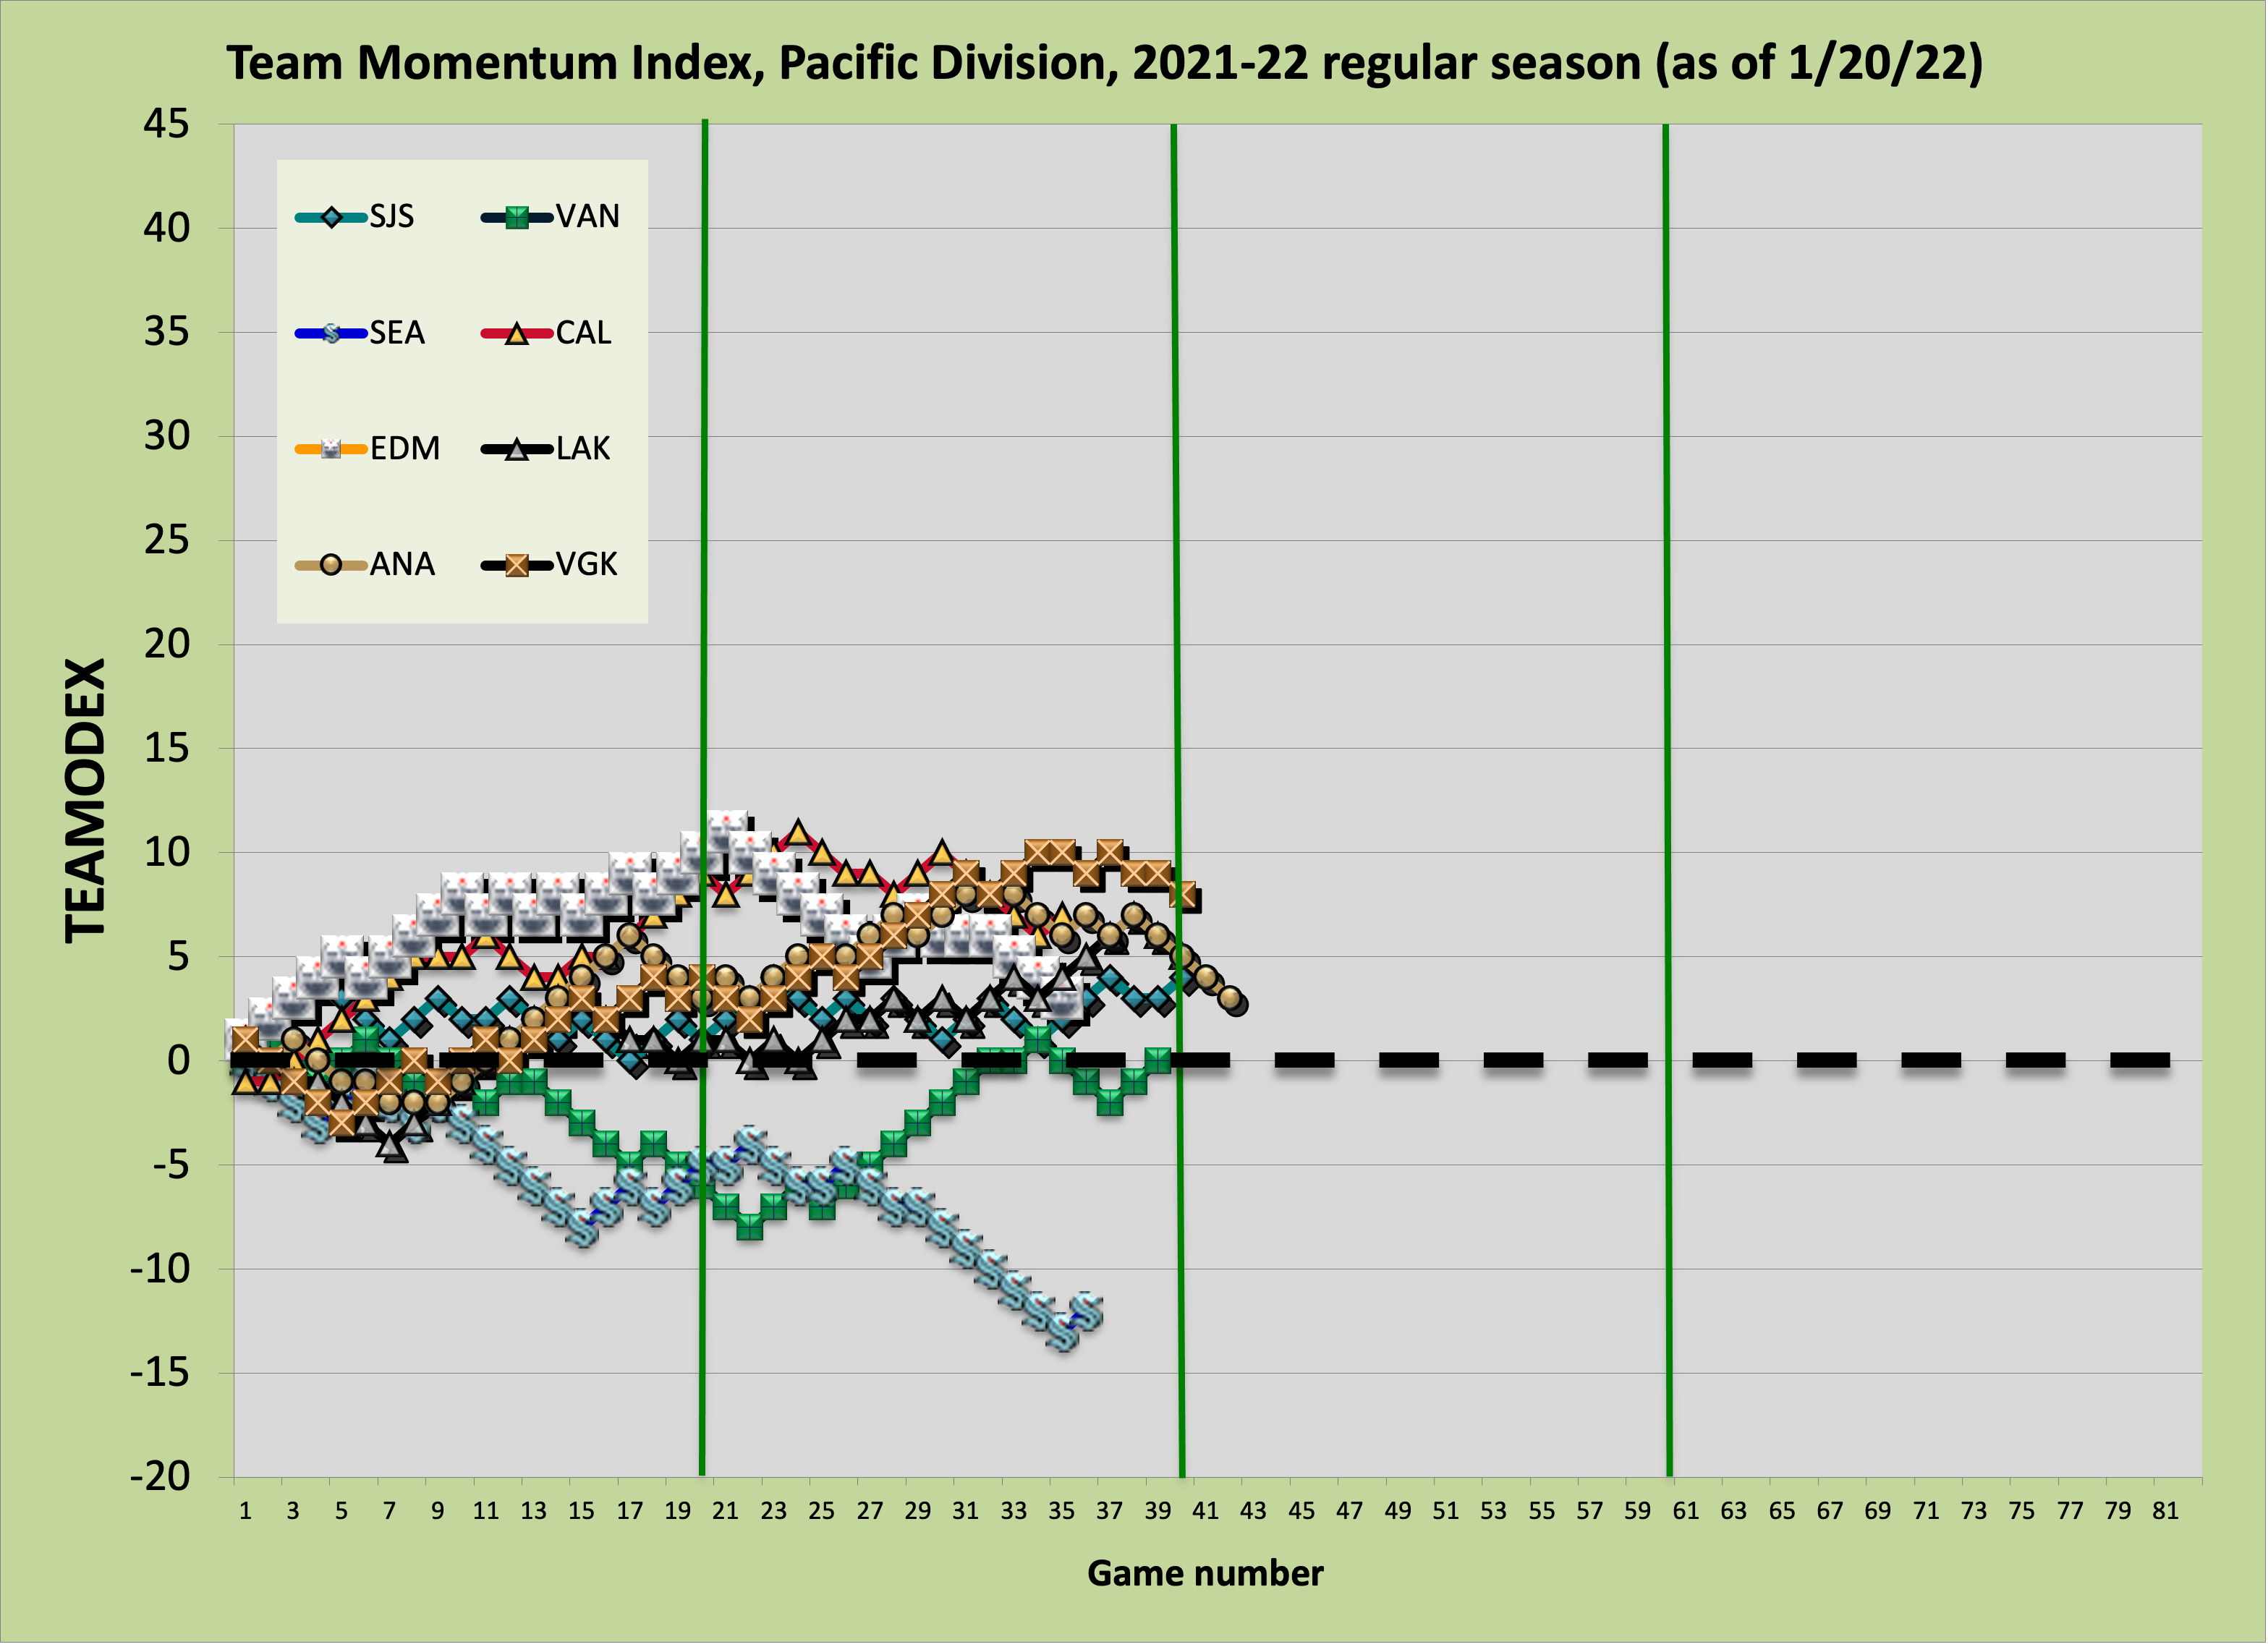
The Pacific (green): The Pacific remains the weirdest division. There is more chaos here than any other division. No team has been able to pull away as the top 5 squads trade punches. Seattle looks like a typical expansion team after going ice cold in Q2. Vancouver looked ready to make a charge but lost their juice around game 35. The lead in momentum was traded in Q2 between the Oilers, the Flames and VGK. None had a particularly momentous quarter however.
I hope these graphs help add color to the standings. The four divisions have different shapes and patterns. In previous seasons, the third quarter holds the key to where we end up on day 1 of the playoffs. Will we see regression to the mean or further spread? Which team will surge in the Pacific? Can Boston catch the leaders in the Atlantic? Will it be the Blues, Preds, or Wild who will battle the Avs to rule the Central? Which of the big 5 will wilt in the Metro? Can’t wait to see.
