Salaries are rising in the NHL and rising fast. The cap has gone up but slower than many hoped. It’s time to wonder whether things are moving too fast for the long term health of the league.
How would we know if it’s getting nutty (or more importantly, unsustainable)? One simple idea I had was to compare the value of players signed in the last few months to a few select, undisputed high value players from a few years ago using a metric that allows an apples-to-apples look.
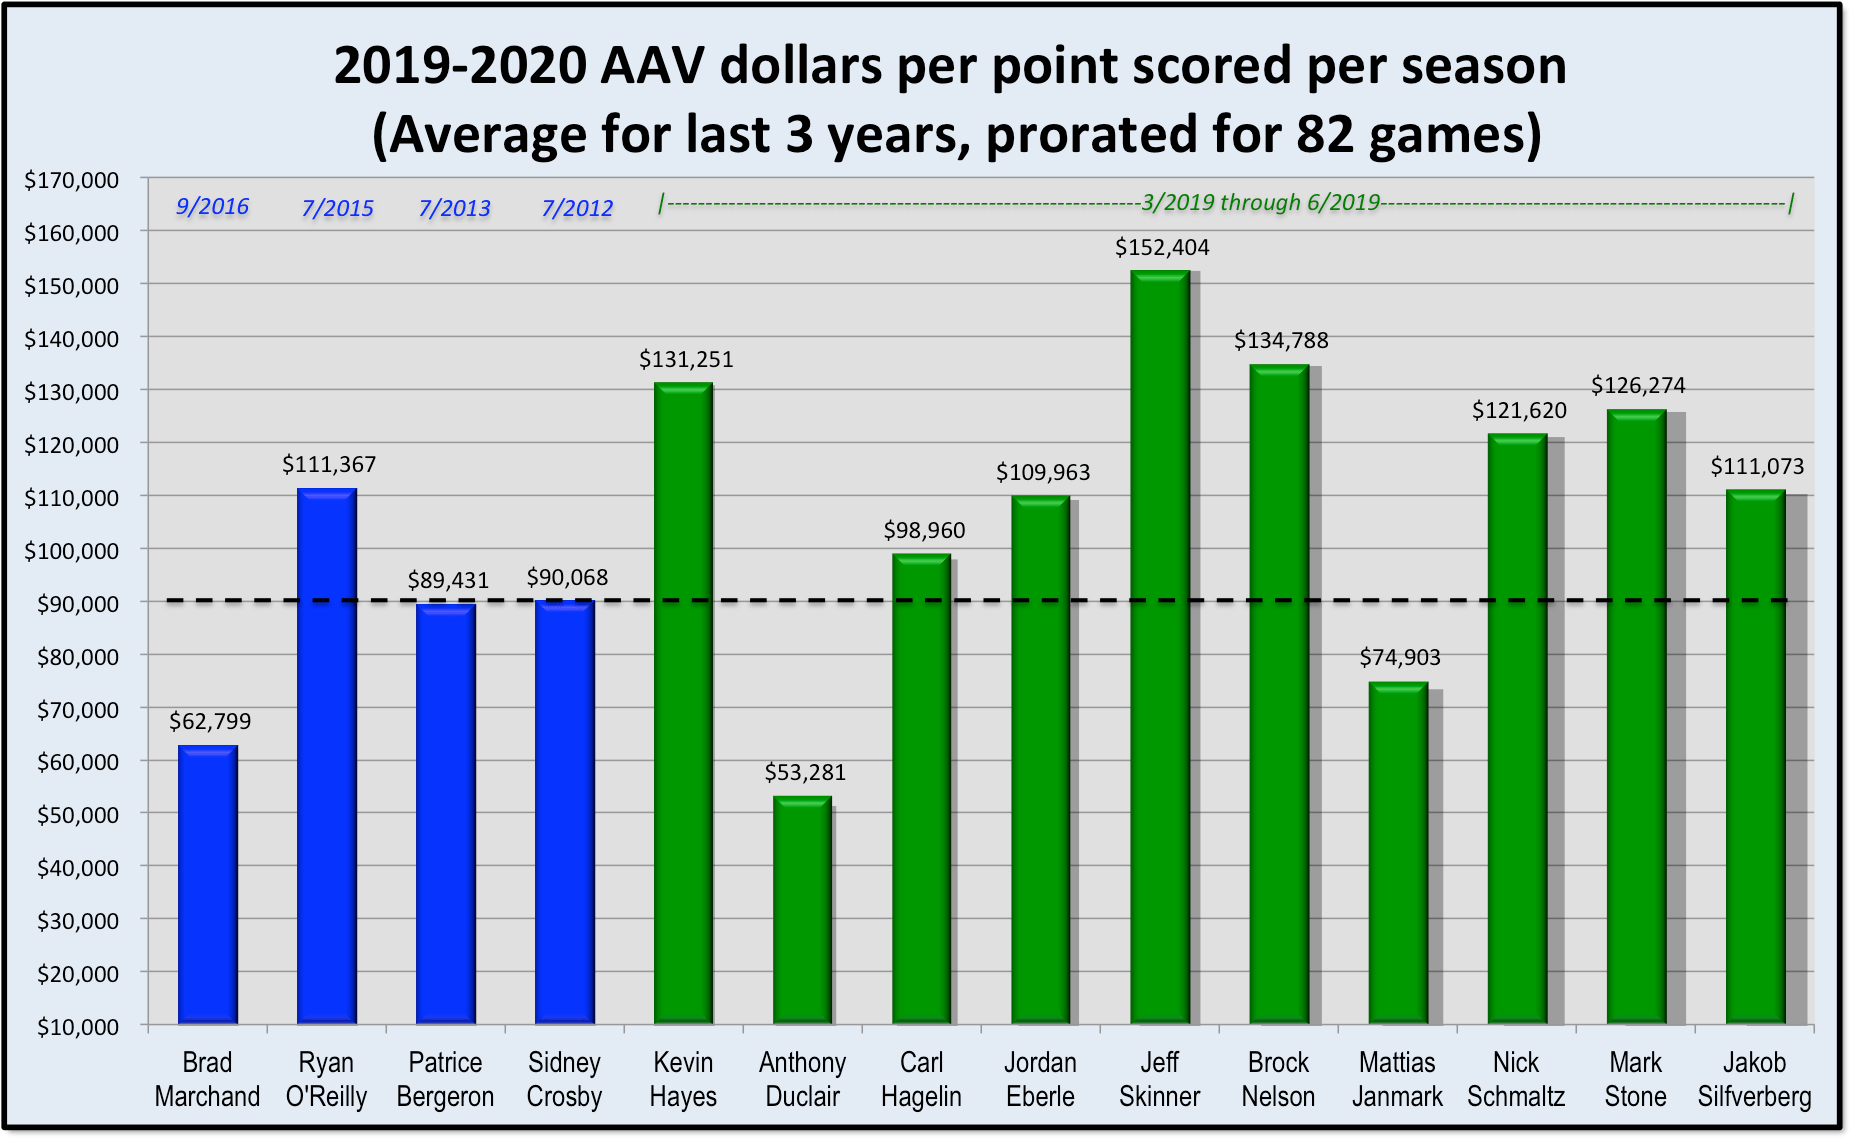
To do this, I used data from NHL.com and CapFriendly to compare what teams will be paying players in 2019-2020 in AAV dollars per point scored per season. Here is what I came up with:
The details:
The blue bars represent players “gold-standard” high-value players who signed standard contracts between 2012 and 2016 (signing dates in blue above). The green bars are all the standard (not entry-level etc) contracts for forwards signed since March 1, 2019. To maximize comparability, I took games played and total points scored for the past 3 seasons and estimated an average points scored per season weighted to assume each player played the same number of games (82). The dollar values are the AAV for the 2019-2020 season based on CapFriendly. No performance bonuses were taken into account. My method differs from CapFriendly’s way of computing dollars per point.
So what do we make of this?
The most recent (standard) contracts signed for forwards in the NHL have been consistently higher in AAV dollars per point than even the best-of-the-best from the recent past.
Lets look at how teams are paying recently signed players compared to Sid Crosby, who all would agree is a high-value player. All but 2 of these forwards are making more per point than Crosby. That does tell us there is some variability in player value in the newest contracts. On the other hand, its worrisome for the league that players like Duclair and Janmark are now making comparable dollars per point.
Three contracts really stand out here. Teams are paying Kevin Hays (46% more), Jeff Skinner (69%) and Brock Nelson (50%) around fifty percent more per point compared to Crosby. This signals a salary inflation that doesn’t match the rise in the cap.
How long will it be before valuations for top players become so out of whack that teams are unable to round out their rosters with lower priced talent?
Obviously, salaries are going up and they should. But, what does it mean for the league when solid NHL players are making 50% more per point than super star gold standard players?
Using this metric shows the salary inflation in a different light by putting salaries in the context of value (at least as far as points).
I believe the NHL is headed toward a bubble.
The Details:
Blue bars represent selected “gold standard” high-value players who signed standard contracts between 2012 and 2016 (signing dates on top in blue). Green bars are all the standard contracts signed since March 1 2019 for forwards. To increase comparability, I took games played over the past 3 seasons and total points scored to create and average points scored per season. That number is prorated to simulate what each players average point production would be if each had played 82 games each season. Data come from NHL.com and CapFriendly.com. My method differs from the method used by CapFriendly to estimate dollars per point scored. My method ignores performance bonuses.
