I listened intently to the talking heads of the hockey world all summer and during the nascent 2018-19 season. At some point, I have heard some luminary proclaim all four of the divisions as the best, toughest, most competitive division. There are no easy games X4. Parity is the new religion of the NHL. But that seems sloppy to me.
So which division is the most challenging? Some say it’s the Atlantic. Others say the Metro. Others will say the Pacific or the Central. If we consider all of the 2017-18 season from a data standpoint, what question could we ask to address this question more systematically?
I asked three questions. First, let’s add up goal differential summed over all teams within a division to see which has the best surplus of goals scored vs. allowed. Second, let’s add up all the points scored by each division when playing out-of-division opponents. The division that racks up more points playing inter-divisional opponents, it would stand to reason, is probably the strongest division. Third and finally, the strongest division should produce the lowest within-division point totals because the teams of that division are the toughest opponents.
Let’s consider all of last season. The cup champ came from the Metro (as it had for the previous two years). But there is a pundit for every corner of the hockey-sphere. Turns out, there is a very clear winner when considering these three metrics.
I built a database for all games last season for all 31 teams (using data from Hockey Reference) and computed point totals for out-of-division vs. within-divisional games as well as overall goal differentials for each team. Then, I summed these values within the four divisions and made a graph.
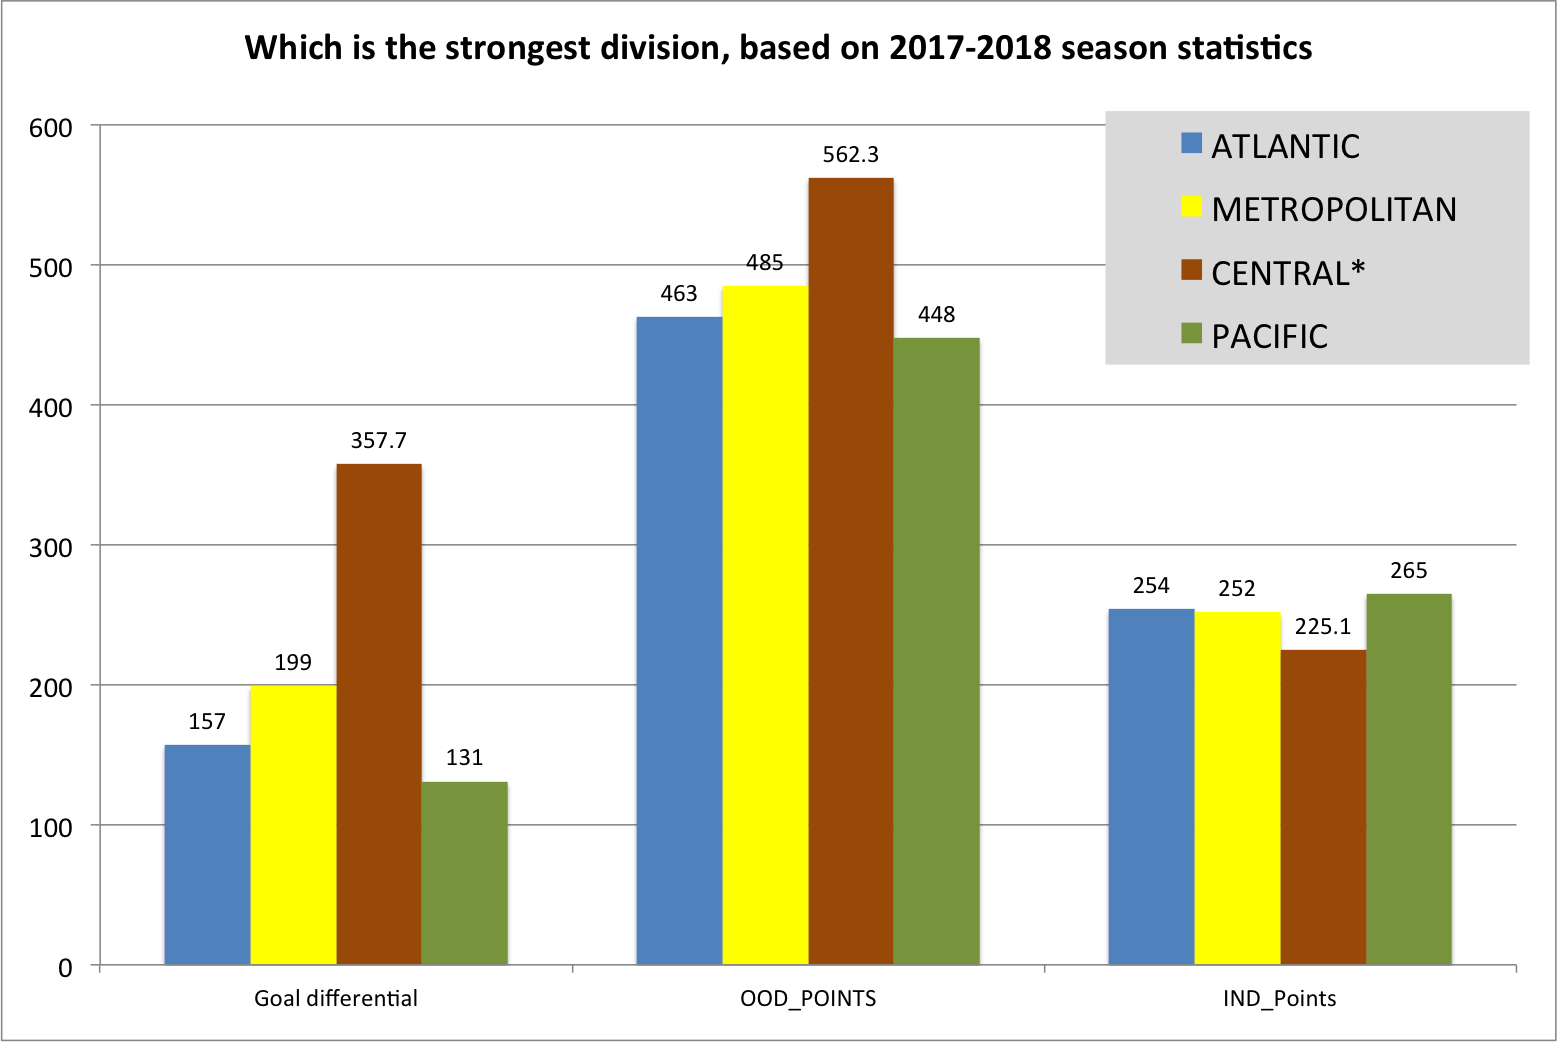
* One note: because the Central division is the only one with 7 rather than 8 teams, the data displayed have been adjusted using a standard statistical technique to correct for different denominators.
In each of the three comparison metrics, the Central division demonstrates superior competitive advantage. And for those of you who are stat-heads, I did check and these differences are “significant.” Teams in the Central have a decided advantage in terms of goal differential (+158 greater goal differential compared to the Metro), and extra-divisional competition (a 77-point advantage over the Metro). Correspondingly, teams in the Central did worse against each other than did teams of any of the other three divisions.
The Metro held a slim margin in second place. The Pacific was clearly the worst division, generating a whopping 114 fewer points in inter-divisional play.
Let’s be more systematic when we say that every division is the toughest. We don’t know if this pattern will repeat this year, but last year, the Central was king.
