It’s summertime. The Canadians are all at their cottages (whatever that means) and the NHL Network is dominated by repeat broadcasts of games we have already heard.
It’s a dull time for hockey fans.
Sure, there is the odd bit of trade news, some buzz about the upcoming World Cup, and the fascination with Boomer’s stat packs and “five burning questions.”
The summer is a time for thinking big picture about the game we love.
I started thinking about how it must feel for Capitals fans. Your team won the Presidents’ Trophy, and you were (again) dumped in an early round.
It turns out that in most professional sports, the playoff outcome seems to be a surprise relative to the regular season. This suggests that the playoffs are subject to random forces. It’s worst perhaps in football where playoffs are determined by the exigencies of what happens on one particular day in one particular stadium. At least in baseball and hockey, we have the luxury of watching a seven-game series play out, with the idea that over the long run, the better team will advance.
However, in all major sports, the playoffs seem to be a “new ballgame” relative to the regular season. Often, the top-ranked team doesn’t make it “deep” into the playoffs, and any given team that might squeak in could get hot and go all the way.
For example, in the NHL, over the last twenty years, do you know how many times the top-ranked team (based on total season points) has won the right to hoist Lord Stanley’s Cup? Only five times (or 25%). That percentage is not bad, and suggests that the playoffs do ferret out the best team sometimes. However, in the most extreme case, the 13th-ranked team in the league won the big prize (LA Kings in 2012).
But returning to the plight of the Caps fans, I found myself wondering which franchises over- and underperformed in the playoffs relative to their regular season finishes. Which teams exceeded or failed to meet expectations for performance in the playoffs?
To answer this question, I collected data from Hockey Reference for regular season performance and playoff results for the last twenty years (1996–2016). I then compared total points and end of regular season rankings to playoff results. I created a “playoff expectations met” index by assigning points to each team for each year based on their playoff results relative to their regular season points ranking. I am happy to share the details of this index for anyone who requests it, but the idea is simple. Teams ranked first or second are expected to be in the Stanley Cup Finals. If they are, their index for that year is about 0. Zero means the team performed as expected. But what about a team that finished first in the league that got bounced in the first round? That team got -5 points. What about a team that squeaked into the playoffs and overachieved, losing in the Stanley Cup Finals? They got +4 points. For any given year, a team gets positive points if they finish above where they should have based on regular season standings, and negative points if they were tossed from the playoffs before they should have.
So, over the last twenty years, what teams have over- and underachieved in the playoffs relative to their regular season achievements? What a great summertime question. Here is the answer:
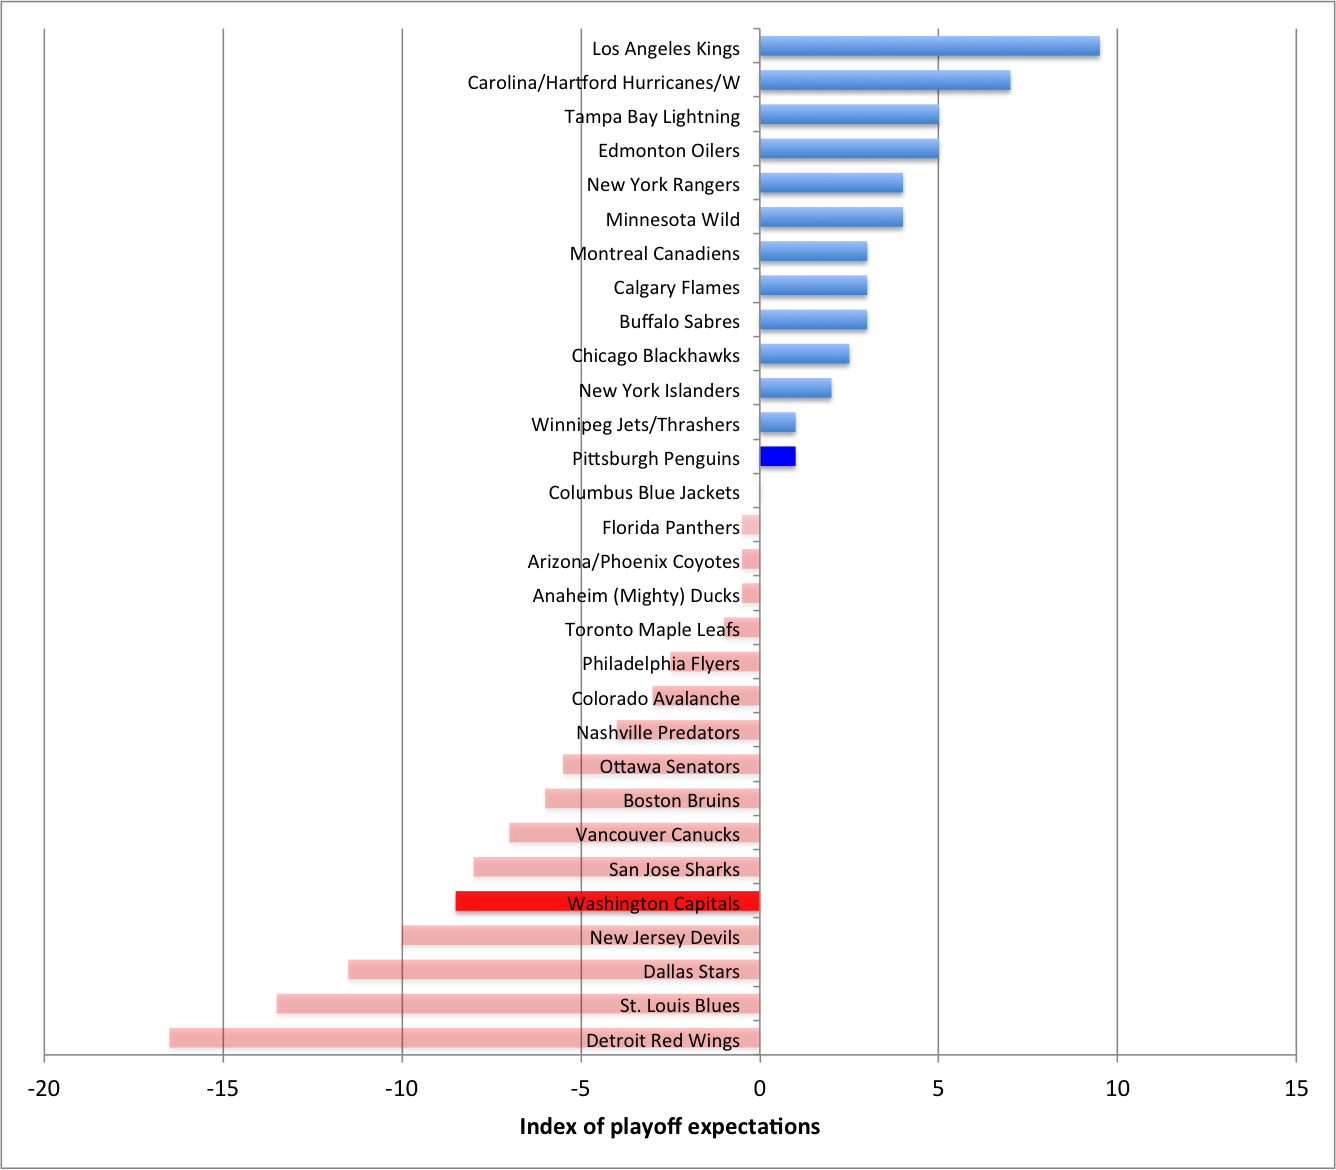
This graph shows the playoff expectations index for all franchises based on results from the last twenty years. Positive numbers mean a team has exceeded expectations by doing better in the playoffs compared to their regular season performance. Negative numbers reflect disappointing performance in the playoff relative to that team’s achievements in the regular season.
The first thing to say is that there is considerable heterogeneity in the performance of different franchises. In part, these numbers are a function of the number of playoff appearances a team has made. This helps explain why the Red Wings are the most disappointing team. They have an impressive stream of playoff appearances (all twenty years in question), and they have won the Cup in that time (four times), but they have also underperformed. The Red Wings are the only team to have achieved over 2000 points over the entire twenty years, and the only team to have scored over 900 wins as a team. However, they were ranked first in the regular season in both 2004 and 2006 and were tossed in the second and first rounds of the playoffs (respectively).
Consider the Kings on the other hand. They have appeared in ten of the last 20 playoffs. The two years they won the cup (2012 and 2014) they were ranked 13th and 9th in the league respectively. In fact, in those ten playoff appearances, the Kings have never been ranked higher than 8th in the league in standing, owing in part to the difficulty of competing in the West.
Caps fans, if you have that funny feeling that your team underachieves in the playoffs, you are right. Along with the Devils, Stars, Blues and Red Wings, some teams seem to have trouble making hay in the playoffs. What makes these underachievers similar? That is a subject of a subsequent post.
This blog is about finding hidden patterns in complex data. Some argue that the playoffs are a “whole new ballgame” relative to the regular season. These data suggest it’s not that simple. There is a “franchise effect” where some clubs are much better or worse at meeting expectations in the playoffs.
Why this pattern exists remains a mystery locked into the metallic fabric of the Cup itself.
