Everybody is talking about parity in the NHL. Listen to NHL Network and inevitably someone will say something like this: In the salary cap environment we are now in, the teams are all so closely matched that it’s hard for teams to stand out, much less repeat.
Well, let’s look at the data. That’s what we do here.
Now first, let’s consider what question we want to ask the data. How should we measure team parity in the NHL? A number of attempts have been made. Brian Costello wrote in The Hockey News that parity was at an “all-time high” this year. He based this on the point totals of the “worst” team, noting that the 30th place team (Calgary Flames at that time) had more points in December than any last-place team in history. The performance of the last place team is not a bad metric, but there are a variety of circumstances where this number can be misleading.
Parity is the variability in the performance of all teams across the entire distribution of teams. It’s not just the best vs. the worst team, but rather we need a number that summarizes how tight the entire league is. A better number would account for the fact that one team might be an outlier (performing way outside the norm) and could then distort the picture if all you did was compare the best to worst team.
Luckily, statistics has a good solution. We call it the standard deviation. It’s the average discrepancy or spread of all teams from an overall average. It does a better job of measuring how tight a distribution really is. The smaller the standard deviation, the greater the parity.
Now consider this graph:
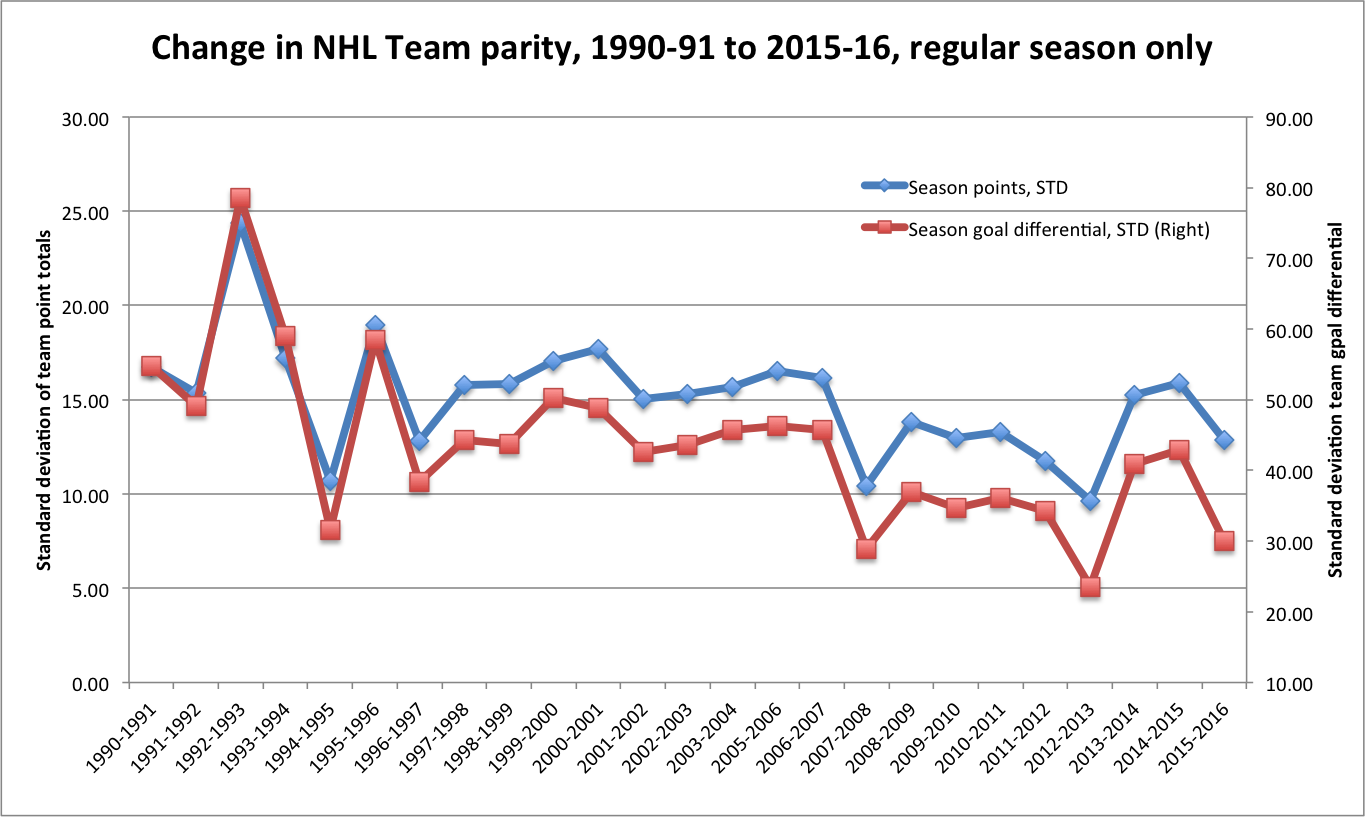
I got data on the entire season for all NHL teams from the 1990-91 season all the way to the one that just concluded (from NHL.com). I show two different ways to look at parity (I computed lots more, but these two show the story consistently). The blue line is the standard deviation of team points for all teams that year. The red line shows total goal differentia, again in the metric of standard deviation.
The story is remarkably consistent. The first thing we can say is that team parity was inconsistent before the late 1990s. This was the tale end of the dynastic era. Since about 2000, parity has been pretty stable. Its certainly not true that parity has increased dramatically. Parity increased from the 06-07 season to 07-08. The year with the greatest overall parity was actually 2012-13. Most interestingly, parity has actually been bouncing up and down in the last four seasons. Parity this year was somewhat greater than it was last season, but it’s no greater than the average for the last five years. Actually, the league looks now like it did in the period from 2008–2012.
In summary, I’m not convinced that parity is at an all time high. The picture is closer to a holding steady pattern. The NHL has been a pretty even league for about ten years. Things got a smidgen tighter this year but its not the tightest it’s been.
The average spread of the entire distribution of teams is a better measure of true parity than looking just at the bottom team or the top vs. the bottom.
